Note
The OpenTelemetry integration is deprecated, and OpsRamp now limits its availability to existing customers, ensuring that only current users continue to access it and not available for the new customers. For more information on logs, see OpenTelemetry and for more information on metrics, see OpenTelemetry Metrics Ingestion.Introduction
To ingest metrics data, follow the on-screen instructions provided under the METRICS section. These instructions will guide you through the necessary steps to configure and ingest metrics data successfully.
Once you have completed the setup, click Finish to finalize the process. This will ensure that metrics data is successfully integrated and ready for use within your OpsRamp environment.
OpenTelemetry Metrics Integration
OpsRamp accepts OpenTelemetry Protocol (OTLP) metrics from OpenTelemetry Collectors using the gRPC OTLP Exporter.
To get started with the OpenTelemetry Metrics Integration:
- Instrument your application using the OpenTelemetry SDK.
- Configure your OpenTelemetry Collector to ingest metrics.
If you are already using an OpenTelemetry integration in your configuration, clean up the existing configuration. For more information, see Clean Up Existing OTLP Exporter Configuration prior to the following steps.
You do not need to deploy a separate Prometheus remote write application. The OpenTelemetry Collector natively supports pushing metrics directly to a Prometheus remote write endpoint.
- In the OpenTelemetry Collector `config.yaml` file, add the following settings for the OpsRamp exporter to enable ingestion into OpsRamp.
Note
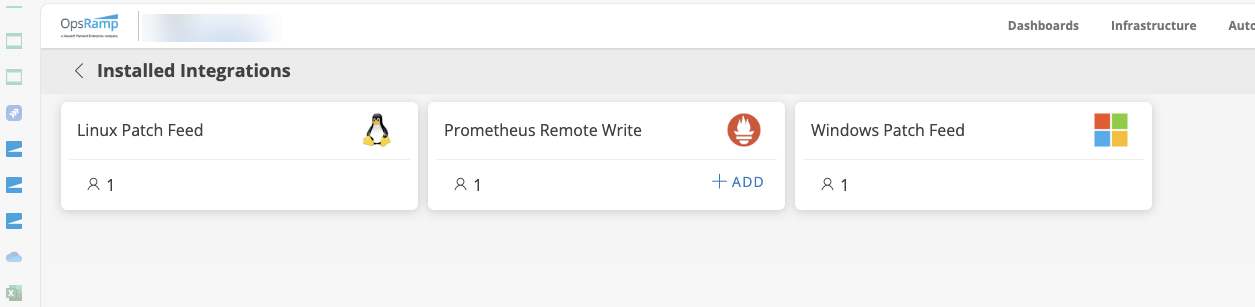
If the OpenTelemetry Collector is deployed in a Kubernetes cluster, edit the otel collector ConfigMap accordingly.- Navigate to the Integrations page and click the Prometheus Remote WriteM application.
- In the Configuration screen, click + ADD. The Configure screen appears. Enter the following information to proceed with next steps.
Functionality Description Field Type Name Enter a name. String Type Select Normal. Dropdown 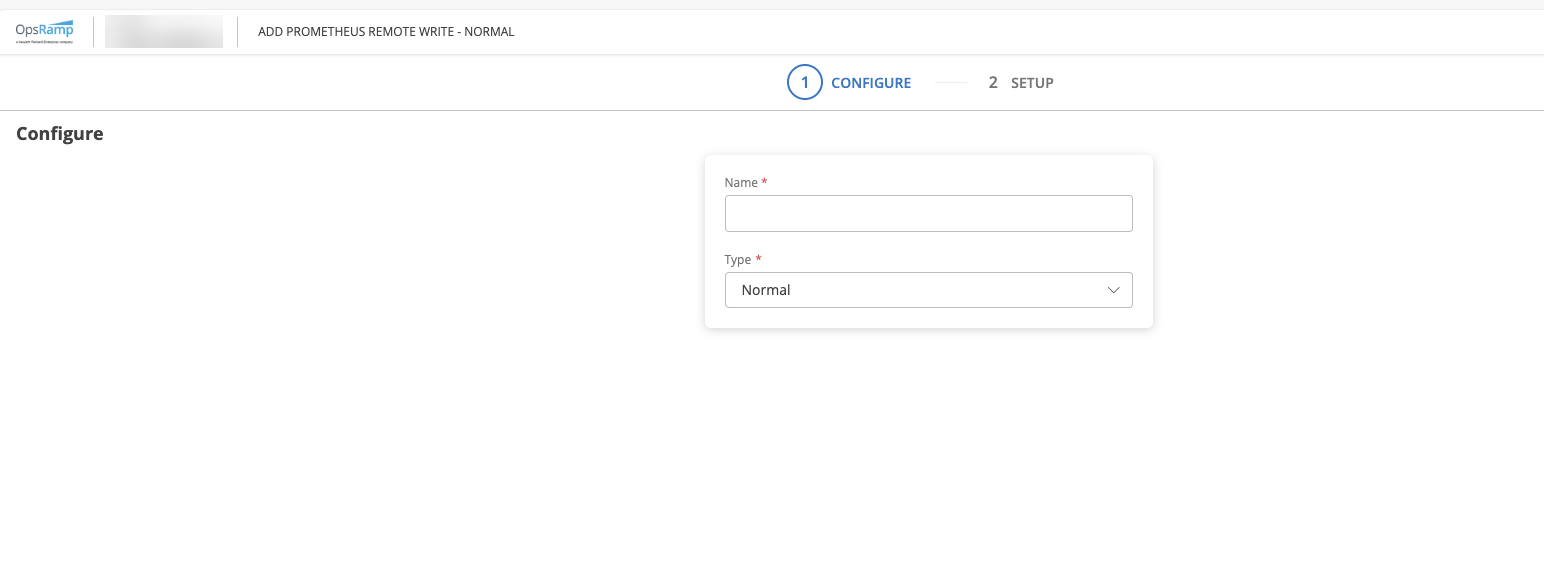
Click Next.
- The Setup page appears.
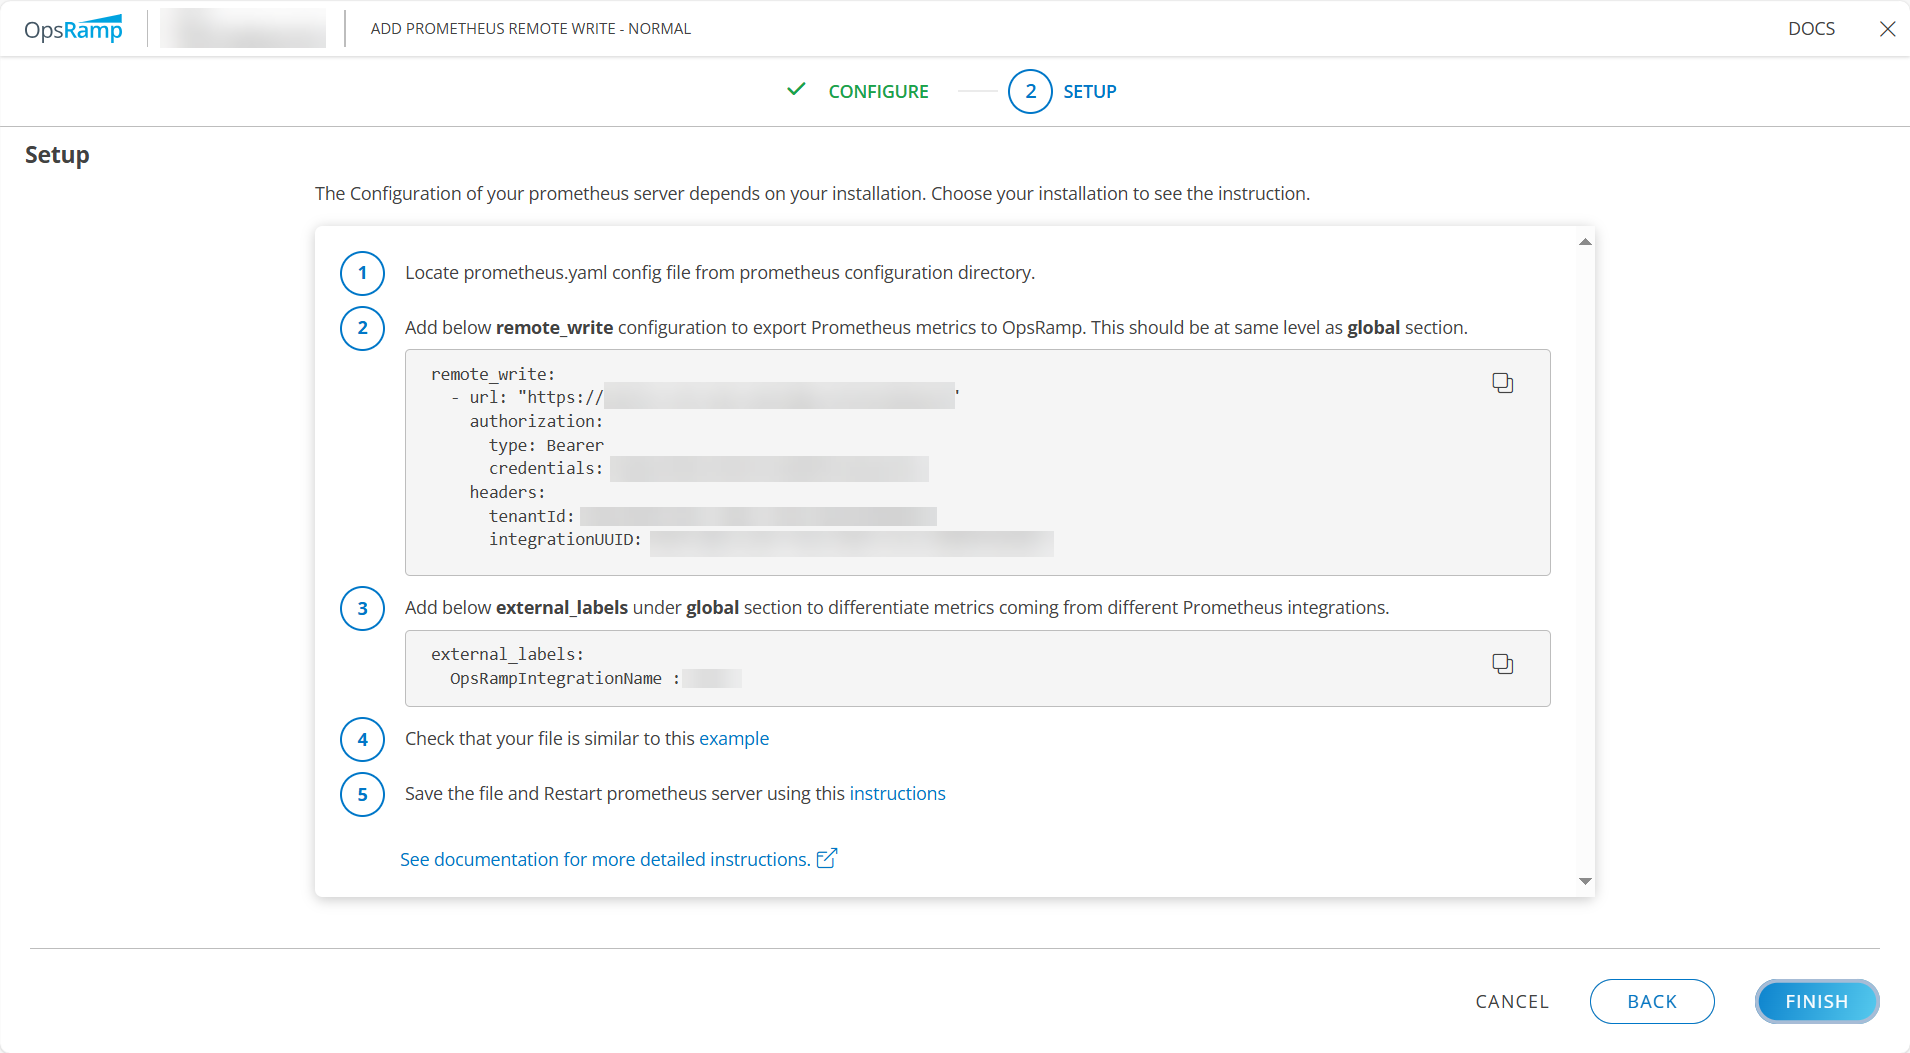
- From the values displayed on the Setup page, add the corresponding entries to the exporters section of the config.yaml file.
exporters:
  prometheusremotewrite:
    endpoint: "<paste the url value here>"
    headers:
      tenantId: <paste the tenantId here>
      integrationUUID: <paste the integration id here>
      Authorization: "Bearer <paste the token here>"
Note
The authorization token must be prefixed with Bearer, formatted as:Authorization: “Bearer YOUR_TOKEN_HERE”.
- Navigate to the Integrations page and click the Prometheus Remote WriteM application.
- Configure batch processing to improve data compression and reduce the number of outgoing connections used to transmit telemetry.
processors:
   batch:
     timeout: 1s
     send_batch_size: 1000
     send_batch_max_size: 2000
Note
For detailed list of other processors, see processors. - In the service → pipelines section of the configuration file, add `prometheusremotewrite` to the list of exporters wherever you want to push metrics to OpsRamp.
service:
  pipelines:
    metrics:
      receivers:
        - otlp
      processors:
        - batch
      exporters:
        - prometheusremotewrite
Clean Up Existing OTLP Exporter Configuration (requires if already configured)
- Remove the oauth2client section from the extensions block in the config.yaml file. This section appears as follows.
extensions:
  health_check: {}
  zpages: {}
  oauth2client:
    client_id: "<client_id>"
    client_secret: "<client_secret>"
    token_url: "<token_url>"
- Remove the otlp/opsramp_metrics configuration section from the config.yaml file.
otlp/opsramp_metrics:
    endpoint: "<endpoint>"
    headers:
      "tenantId": "<tenant-id>"
    compression: gzip
    tls:
      insecure: false
      insecure_skip_verify: true
    auth:
      authenticator: oauth2client
- Remove
otlp/opsramp_metricsfrom every exporters list under the service → pipelines section in the config.yaml file wherever it appears. - Remove extensions from services config yaml file.