Introduction
The Probable Root Cause (PRC) feature provides AI-powered analysis to identify the underlying causes of inference alerts in OpsRamp. PRC combines natural language explanations with evidence-based reasoning to help teams quickly understand and resolve operational issues.
Manual PRC (Non-Ticketed Inference Alerts)
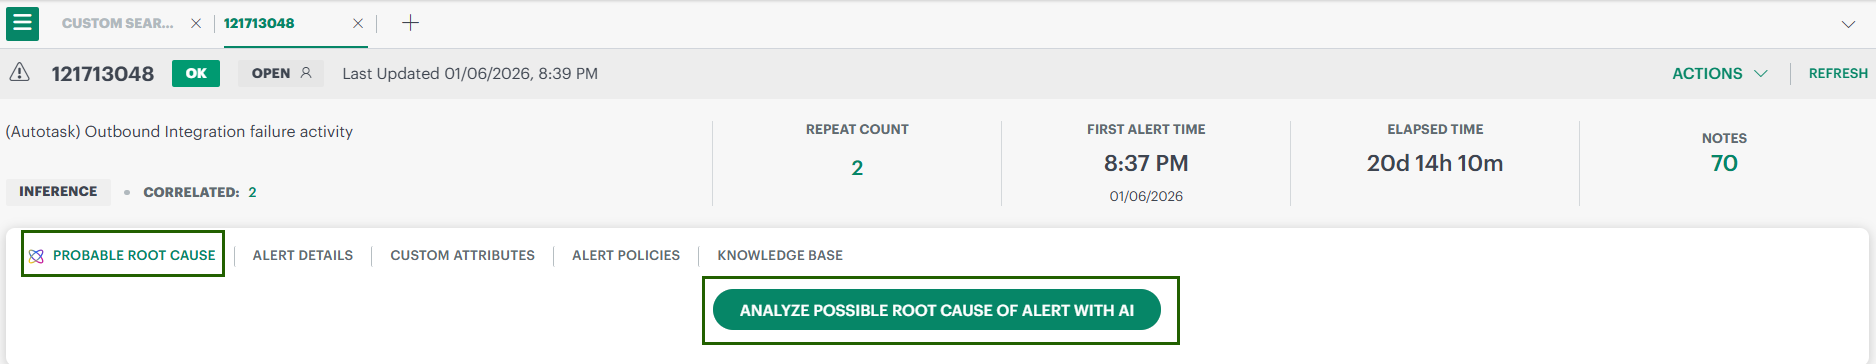
You need to select the Analyze Possible Root Cause Of Alert With AI button. Click this button to generate PRC on demand.
What the PRC Page Displays
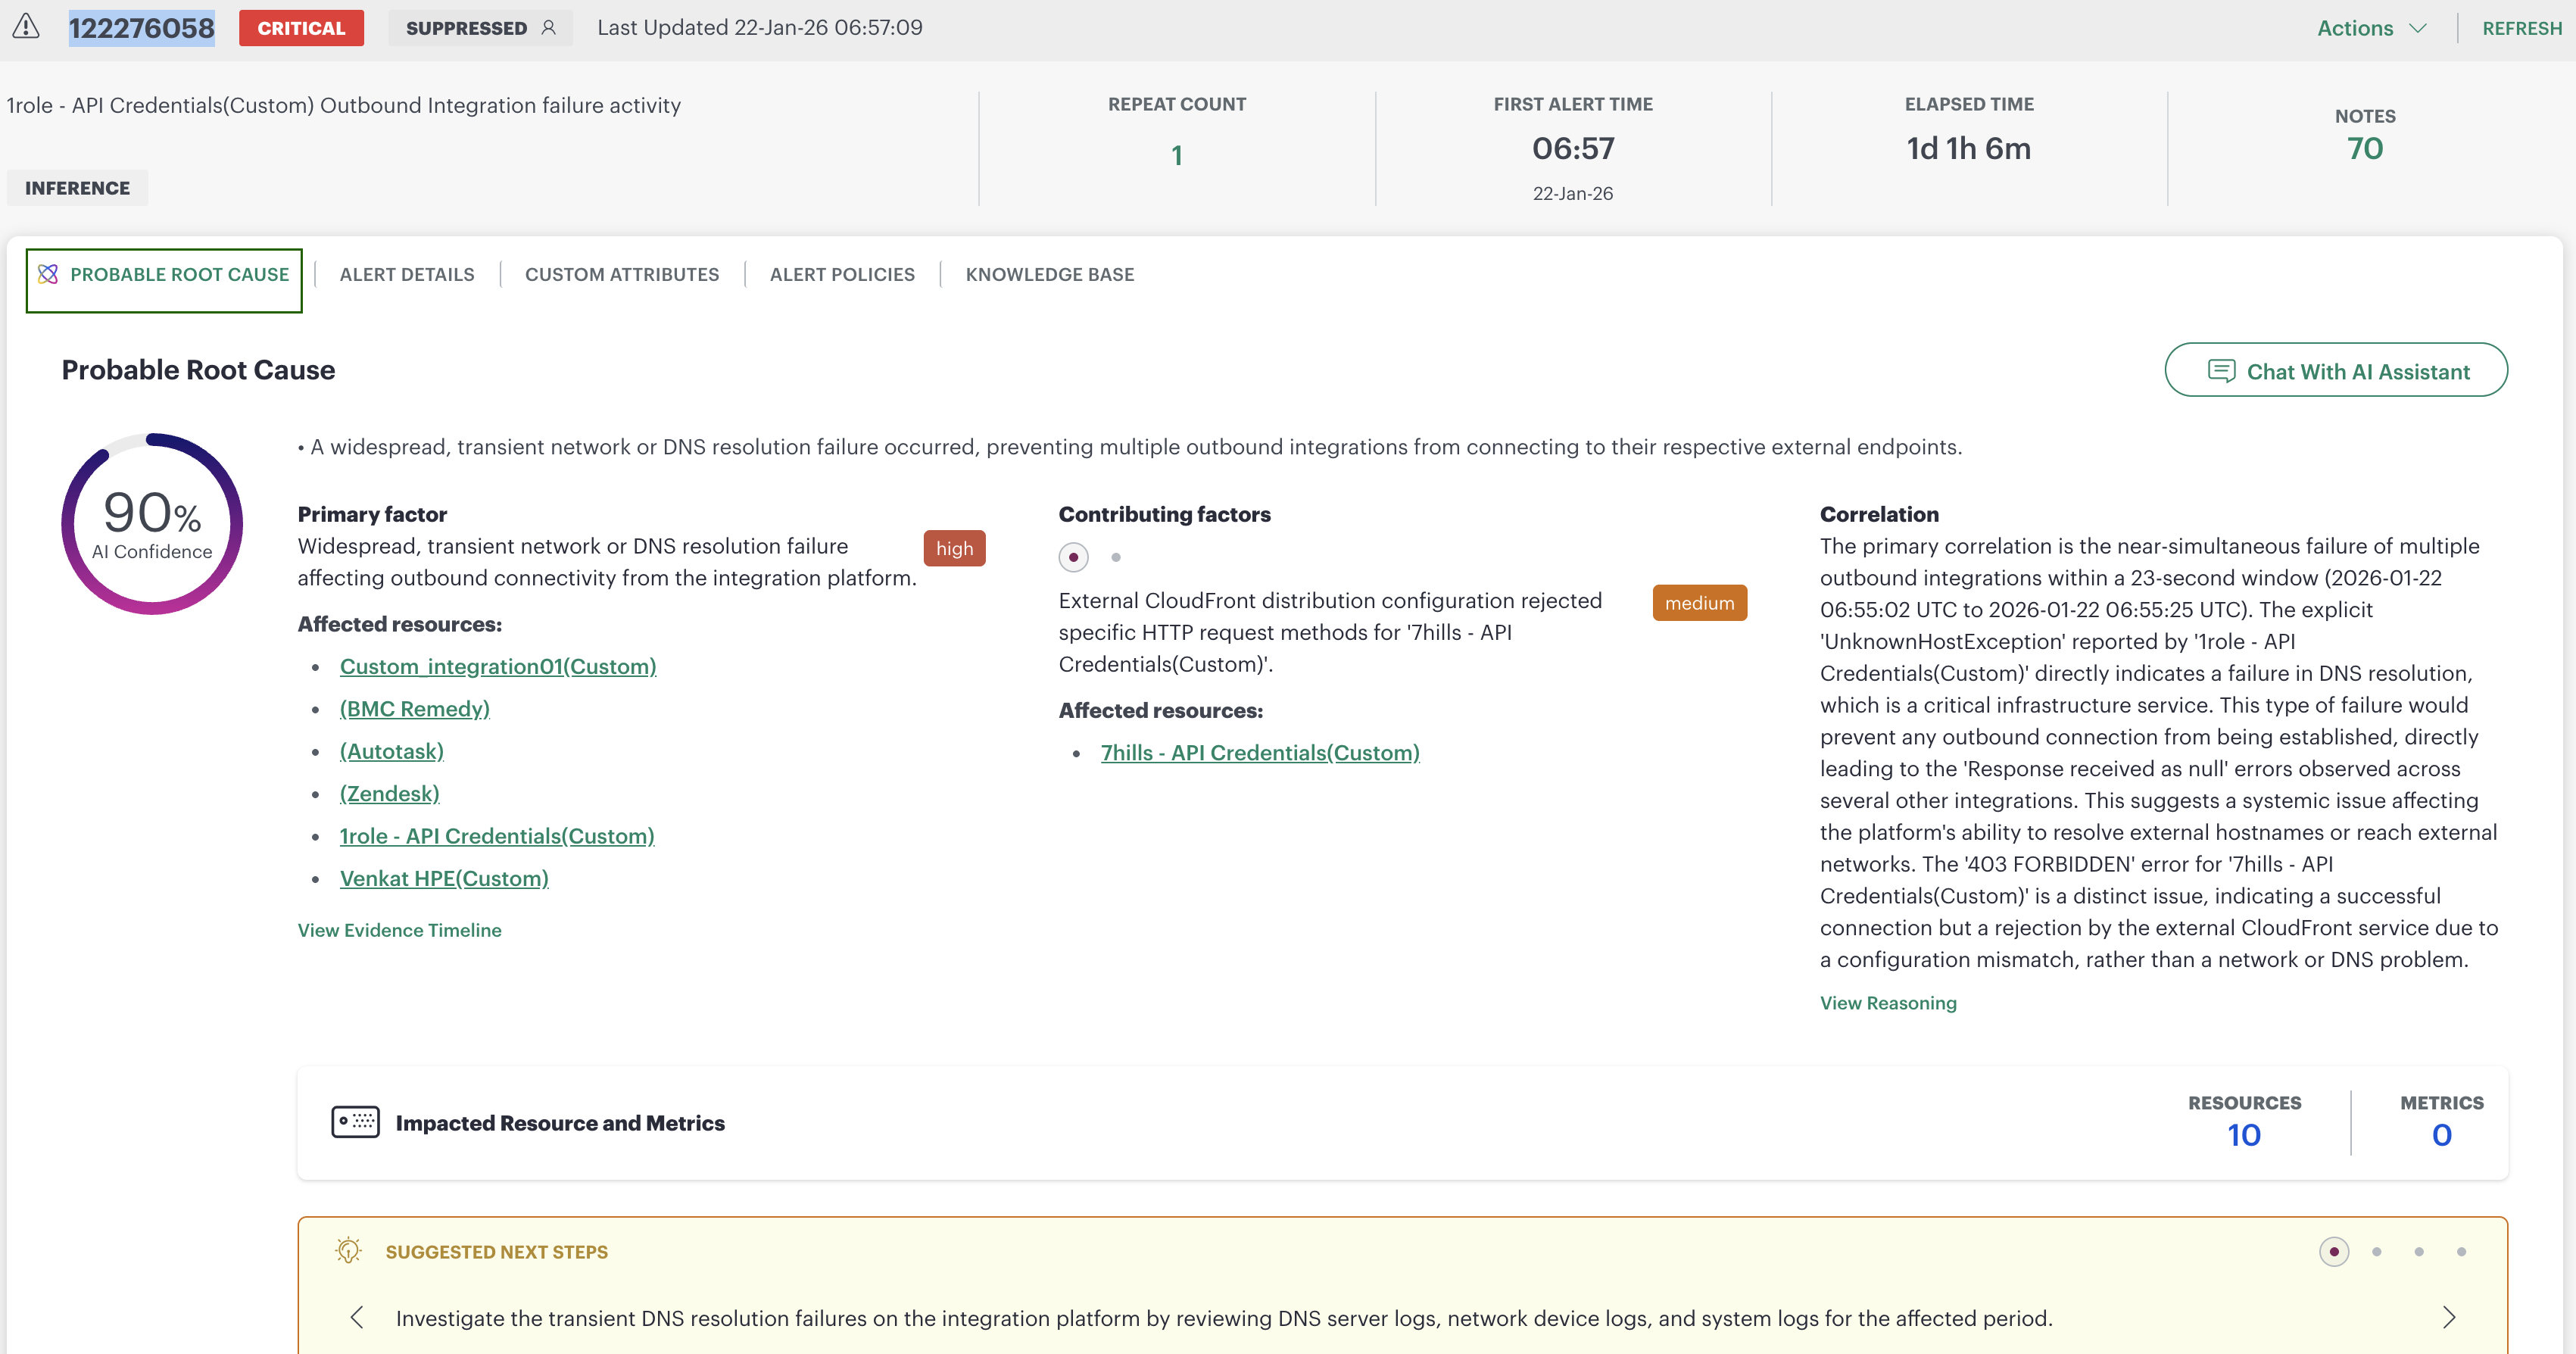
Once generated, PRC presents a structured, end-to-end analysis.
AI Confidence Score
A circular indicator (for example, 90% AI Confidence) shows how strongly the system supports the identified root cause.
Probable Root Cause Summary
A concise explanation of the main issue.
Primary Factor
The main enabling factor that caused the incident.
This section includes:
- A severity label (for example, high)
- A clickable list of affected resources
- A direct link to View Evidence Timeline, since the timeline provides the exact event sequence supporting this conclusion
Contributing Factors
Additional influences identified during PRC analysis.
Each contributing factor includes:
- Severity label
- Impacted resources
- A short explanation of its role in the incident
This helps users understand whether the issue was systemic or isolated to specific integrations.
Correlation Narrative & View Reasoning
This narrative explains why PRC identified the root cause, referencing:
- Event timing windows
- Shared error messages (e.g., UnknownHostException)
- Differences between impacted integrations
Selecting View Reasoning opens a graphical explanation showing how the system evaluated and validated different possible causes.
Deep-dive Views
Evidence Timeline (Deep-dive View)
Displayed when View Evidence Timeline is selected. The Evidence Timeline & Hypotheses screen shows:
- A timestamped list of events (left panel), each labelled by type (for example, symptom)
- A list of Initial Hypotheses (right panel) with confidence levels and category labels (external, application, etc.)
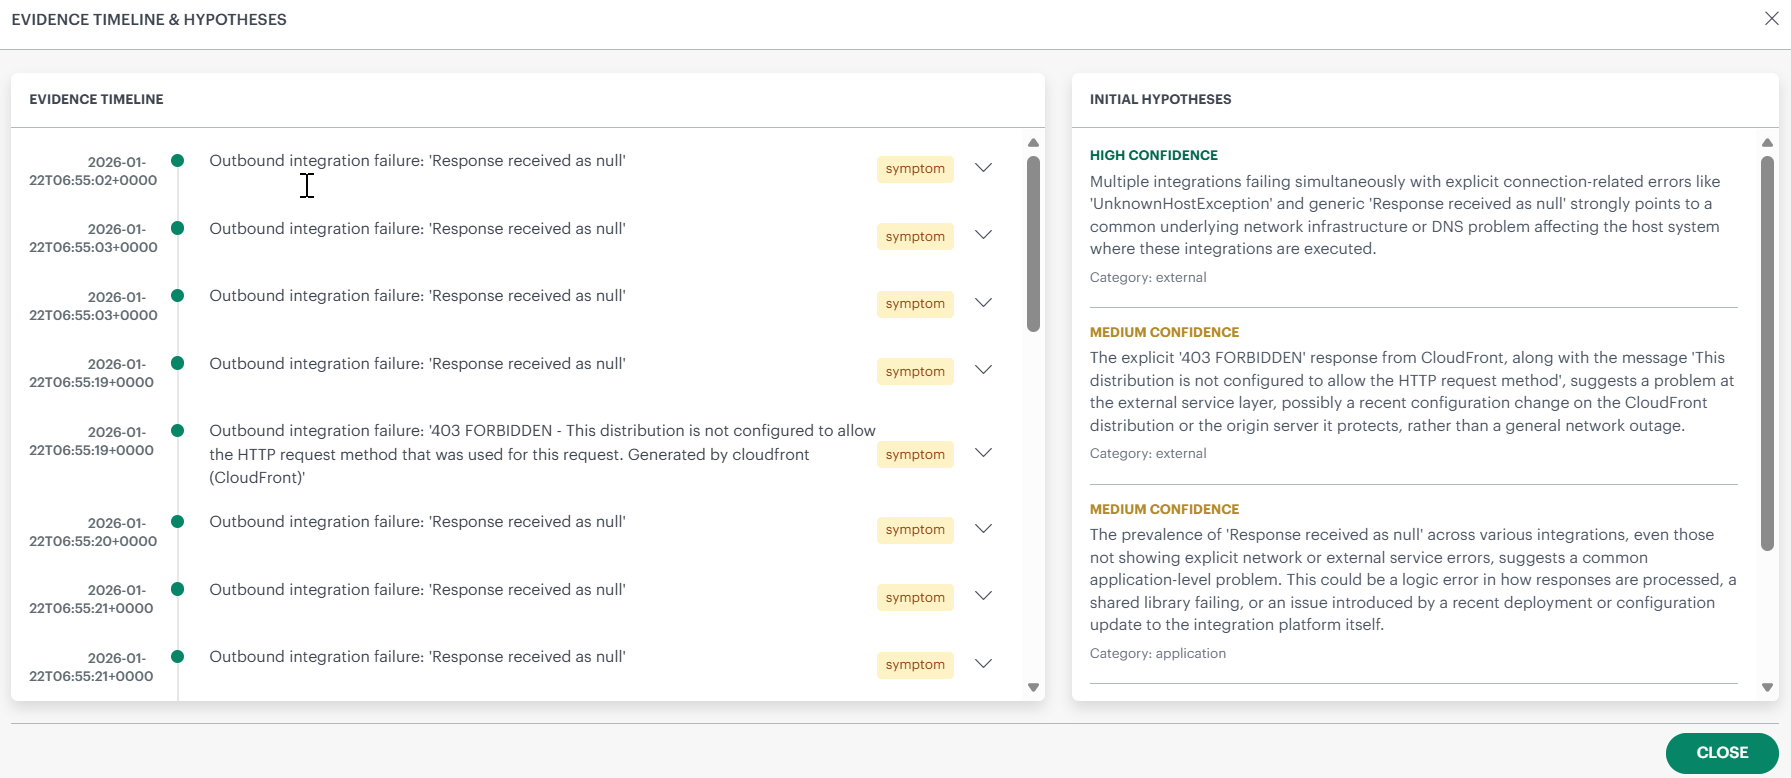
This view helps users validate the sequence of events that led to the inference alert.
Correlation Reasoning (Deep-dive View)
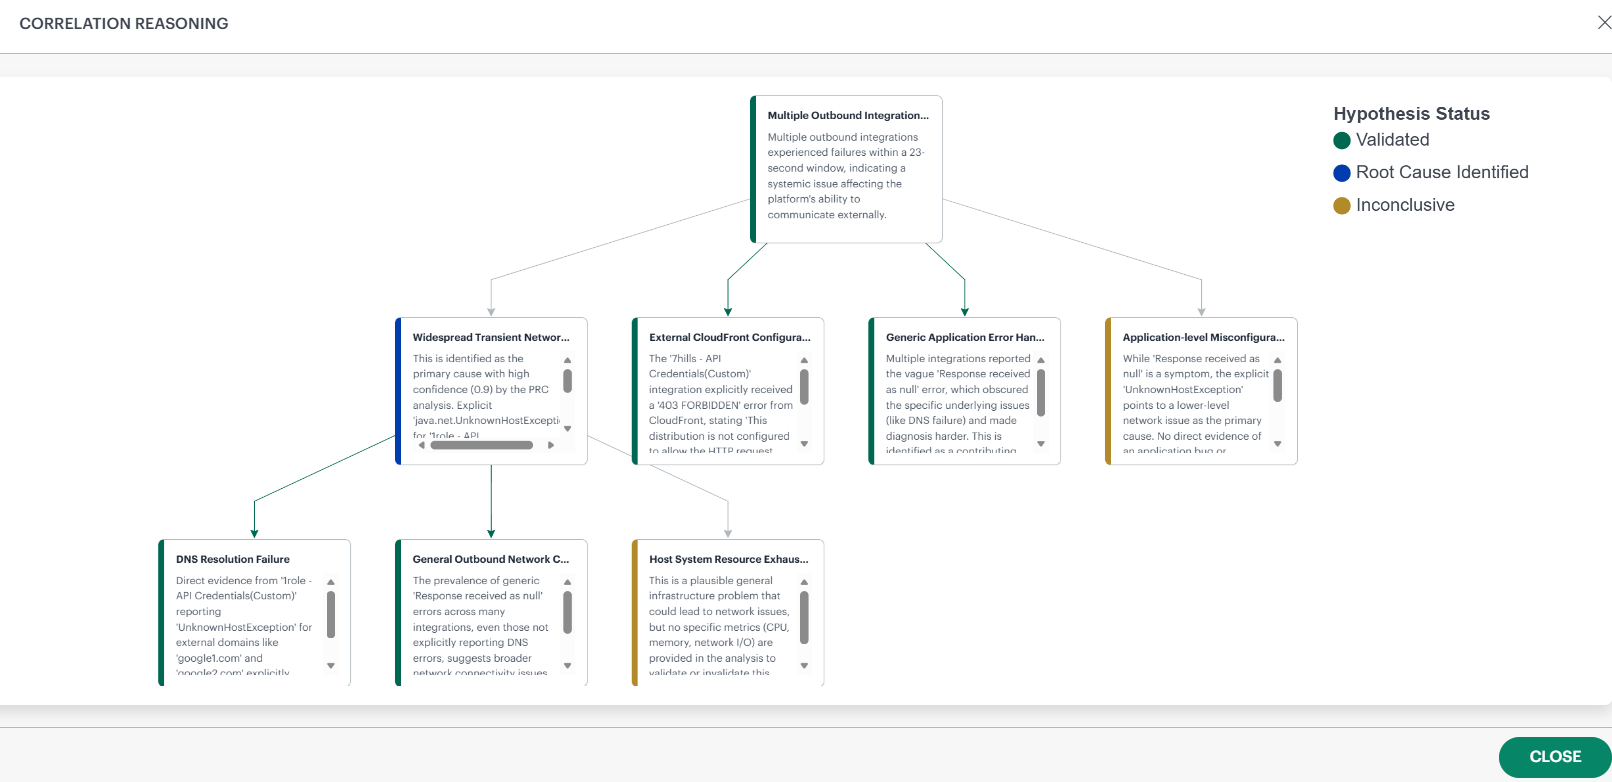
Displayed when View Reasoning is selected. This screen visualizes the AI’s reasoning process as a hypothesis graph, showing:
- All hypotheses considered
- Their evidence summaries (scrollable within each card)
- Their final status:
- Blue – Root Cause Identified
- Green – Validated
- Yellow – Inconclusive
- Red - Invalidated
Arrows show how hypotheses relate, helping users understand how the system narrowed down to the single root cause.
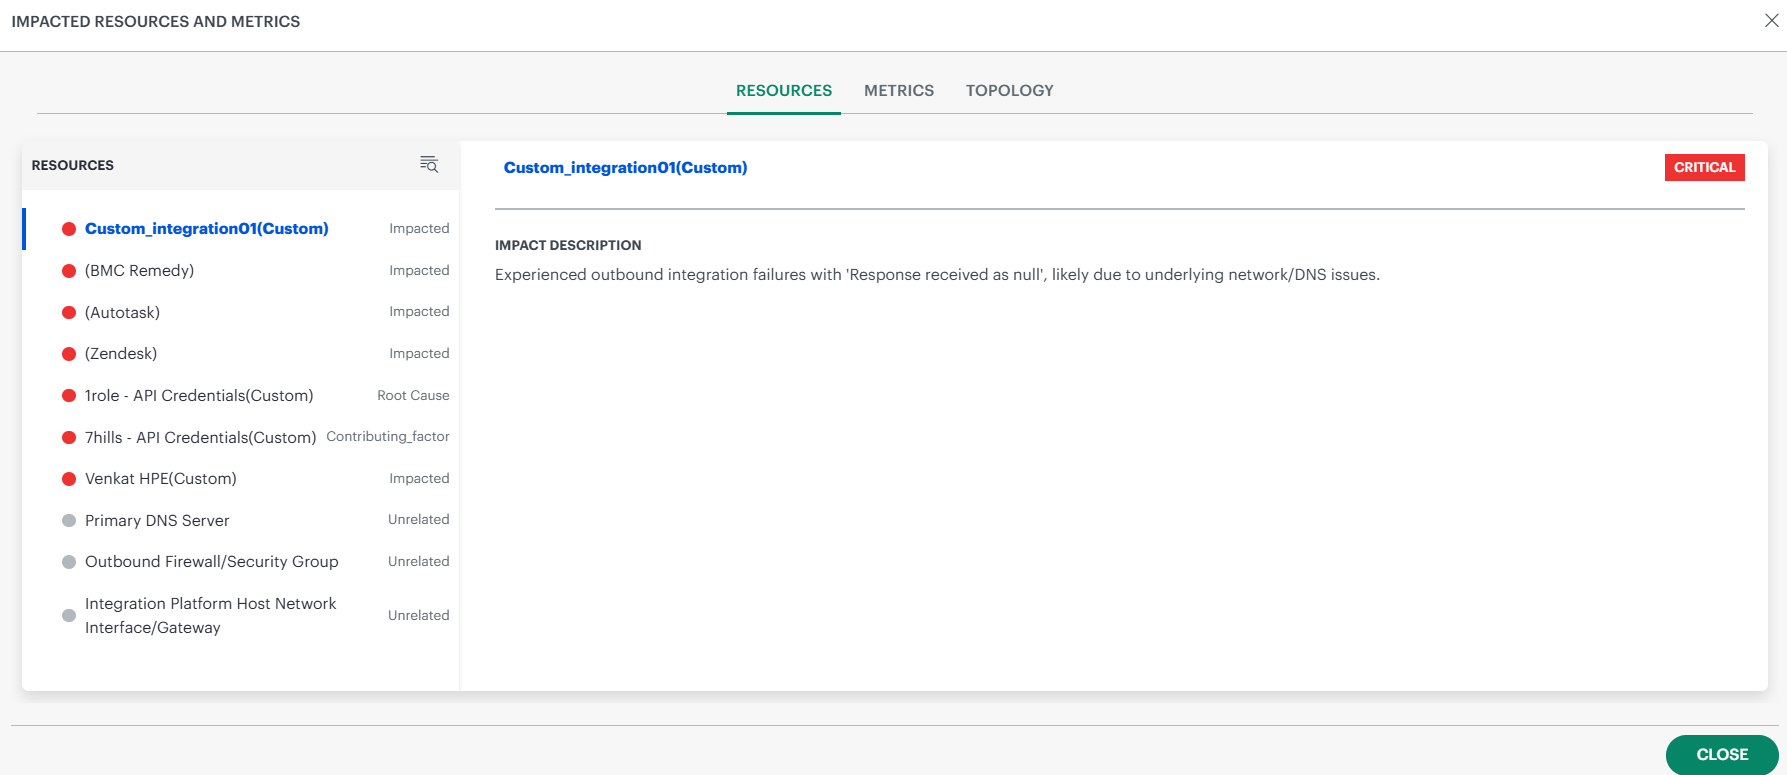
Impacted Resources & Metrics
At the bottom of the PRC page, users see an Impacted Resources and Metrics section. Selecting this tile opens a full-screen drill-down that includes three tabs:
Resources
Shows every resource PRC evaluated, categorized as:
- Root Cause
- Impacted
- Contributing Factor
- Unrelated
Click a resource to show its Impact Description, which explains in plain language what happened to that resource.
Metrics
Displays all metrics relevant to PRC analysis. This allows users to validate evidence visually.
Topology
Shows how resources are connected to each other, helping users understand how the issue propagated.